Robotics & Autonomy
Teaching Cost Curve: how many demos does a robot need?
Measuring the demonstration-count vs. success-rate curve for SmolVLA, LoRA fine-tuned on unseen LIBERO tasks, on a single 8 GB consumer GPU. Nearly all of the value arrives in the first five demonstrations, and so does catastrophic forgetting.
- My role
- Sole author
- Context
- Independent research
- Stack
- SmolVLA · LeRobot · LoRA / PEFT · LIBERO
66.7%
success @ 5 demos
0.66%
params trained
300
episodes / point
The question
Retooling a robot cell for a new part usually means paying an integrator to reprogram it. Industry figures put commissioning and programming at 150–400 hours at $125–200 per hour, roughly $19,000–80,000 of engineering labour per product variant. That price is why high-mix, low-volume plants mostly cannot justify robots at all.
Vision-language-action (VLA) models suggest a different route: let an operator demonstrate the new part a few dozen times and fine-tune. If that works, the cost moves from an integrator’s invoice to an operator’s afternoon. I wanted an honest number for how well it works on hardware a small plant could actually own.
Setup
450M
SmolVLA parameters
0.66%
trained with LoRA r=64
7.36 GiB
usable VRAM (RTX 5060 Laptop)
300
evaluation episodes per point
- Policy: SmolVLA, LoRA r=64 α=64, trained through LeRobot.
- The cell’s existing line:
libero_spatial+libero_goal+libero_10, 1,239 demonstrations. - The new parts:
libero_object, ten tasks the model has never seen. - Protocol: all ten held-out tasks × 10 episodes × 3 training seeds, reported with Wilson 95% confidence intervals. MuJoCo / robosuite, simulation only.
- Compute: 15.3 h of training for the reported runs and ~8 h of evaluation, all on one laptop GPU.
The result
| K demos | operator min / new part | success rate | Wilson 95% CI |
|---|---|---|---|
| 0 | 0.0 | 0.0% | [0.0%, 3.7%] |
| 5 | 2.3 | 66.7% | [61.2%, 71.8%] |
| 10 | 4.6 | 67.0% | [61.5%, 72.1%] |
| 20 | 9.1 | 73.0% | [67.7%, 77.7%] |
| 40 | 18.2 | 76.3% | [71.2%, 80.8%] |
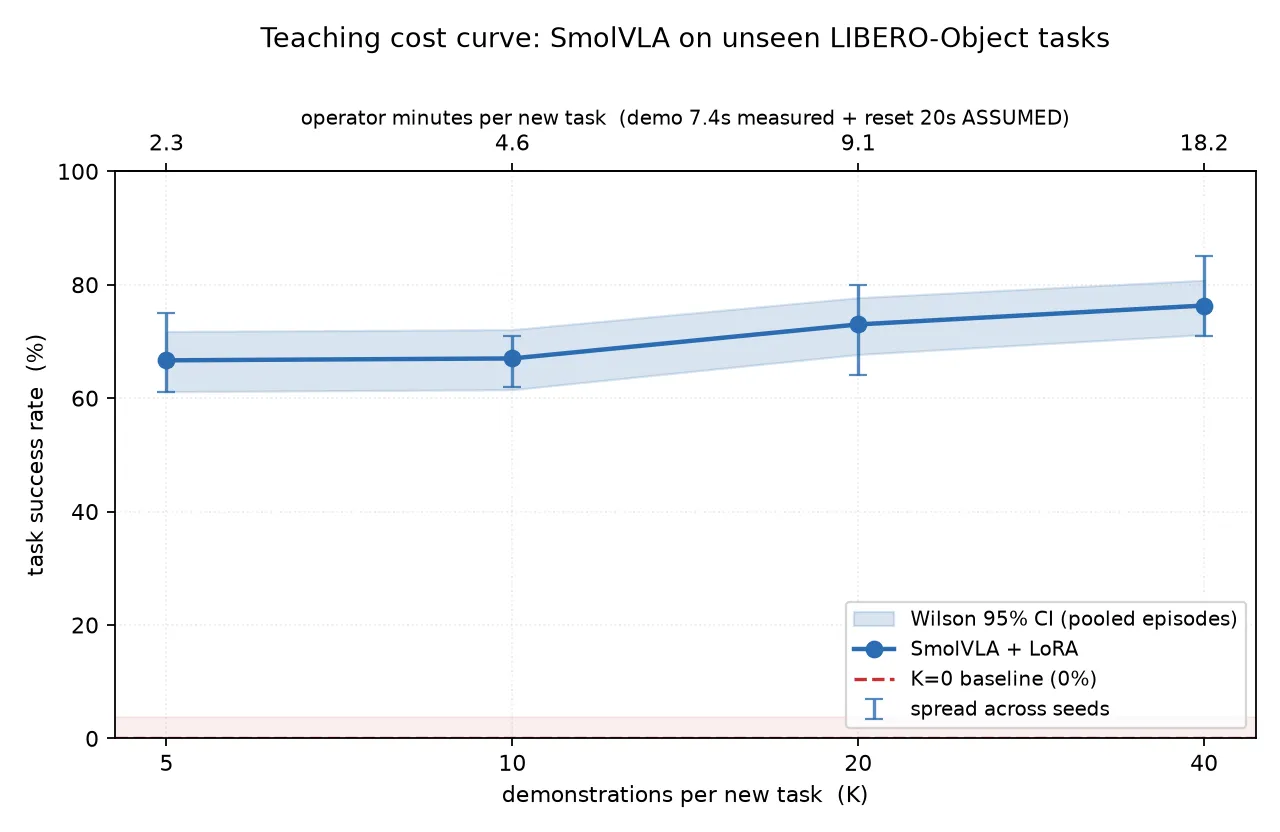
Nearly all of the value arrives in the first five demonstrations. The increments are +66.7 points from zero to five, then +0.3, +6.0 and +3.3. Five demonstrations and forty differ by 9.6 points for eight times the operator time.
The K=0 row is not a strawman: it is the same cell’s own policy, trained on 1,239 demonstrations of three other LIBERO suites. It solves none of the new parts.
The catch: teaching a new part erases the old line
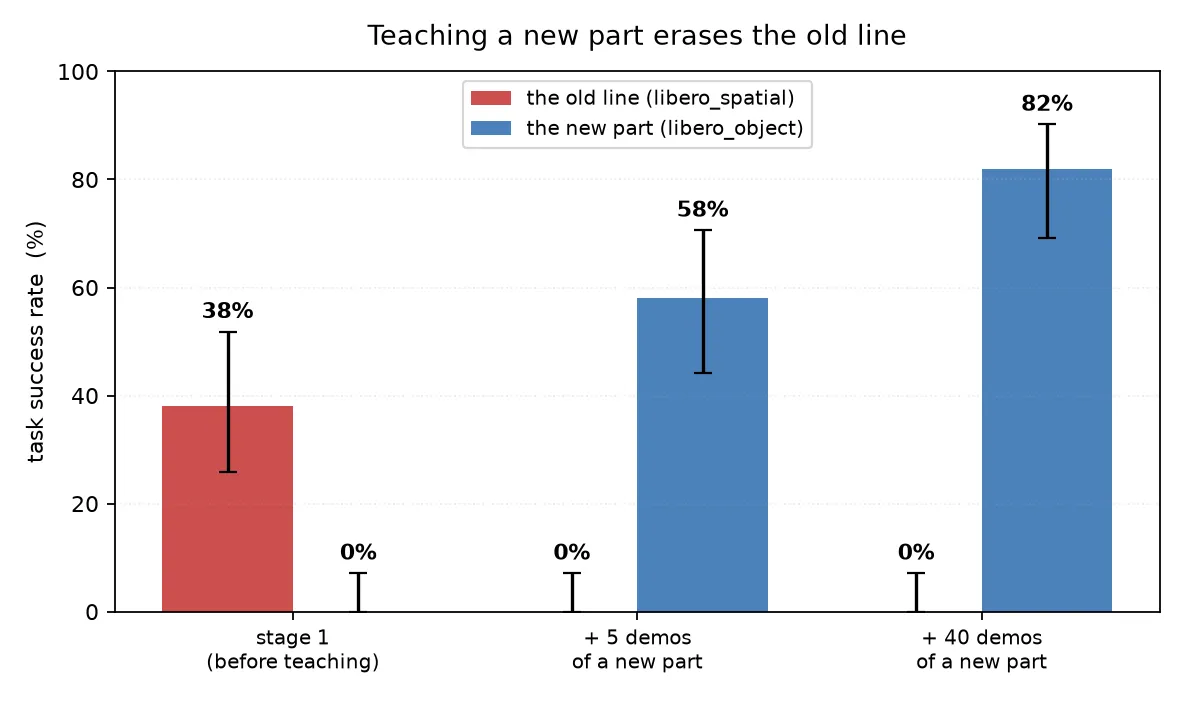
The checkpoint that reaches 58% on the new part scores 0% on the suite it was trained on, down from 38%, and five demonstrations are enough to do it. This is a direct consequence of continuing to train one LoRA adapter on nothing but the new task.
There is a cheap practical answer: each adapter is 11.9 MB, so a plant could keep one per part and load the right one. But that is a different product from “one model that knows the whole line”, and I think the distinction belongs in the result rather than in a footnote.
Measurement traps I hit
The point of the project was an honest number, so the failures are recorded alongside the results:
- The dataset’s
fps: 10field is a playback label, not the demonstration rate. LIBERO controls at 20 Hz (147.5 frames ≈ 7.4 s per demo). Trusting the metadata would have doubled every figure on the headline axis. --eval.n_episodesalso selects the initial states. Two sweeps at different resolutions are therefore different experiments, not a subset and a superset. The analysis scripts now refuse to pool them.- A determinism gate that compares success flags passes trivially when the baseline fails everything. The real gate compares rollout video bytes.
- Training loss runs opposite to success. K=5 converges to a third of K=40’s loss and scores worse, so loss is not a model-selection signal here.
Honest limitations
- Simulation only. No real hardware; the sim-to-real gap is not measured.
- Failure modes are not classified. An upstream LeRobot bug makes rollout recording unusable for LIBERO.
- The existing line is undertrained (38% on its own suite) because the step budget was held constant while its dataset is 3.5× larger. The curve is unaffected, since the K=0 reference is measured at 0/100.
- One model, one benchmark, one held-out suite of ten pick-and-place tasks.
- Reset time between demonstrations is assumed at 20 s (73% of the operator-time figure). Changing it rescales the x-axis without changing the curve’s shape.
Engineering
The whole study is one reproducible pipeline: make verify runs six environment checks (including GPU-vs-CPU rendering), make splits regenerates deterministic, nested K-shot subsets, make train chains stage-1 training, twelve K-shot runs and their evaluations, and make curve rebuilds every figure and table. Every stage is idempotent, and 15 invariant tests guard the numbers without needing a GPU or the dataset.