4 min read
Five demonstrations: what it costs to teach a robot a new part
I fine-tuned a vision-language-action model on a laptop GPU to see how many demonstrations a robot needs for a task it has never seen. The answer was five, and getting an honest number was harder than getting a good one.
Muhammet Emin Ayhan
AI & Robotics Engineer
Ask a small factory why its robot cell only ever makes one product and you usually get an answer in dollars. Reprogramming a cell for a new part means bringing in an integrator: commissioning and programming quotes typically run 150 to 400 hours at $125–200 an hour. For a plant that changes products every few weeks, that math never works.
Vision-language-action (VLA) models promise a different workflow. Instead of reprogramming, an operator shows the robot the new task a handful of times and the model is fine-tuned on those demonstrations. If that holds up, the cost of a new part is measured in operator minutes, not integrator invoices.
I wanted to know how many demonstrations it actually takes, and I wanted to measure it on hardware a small plant could own: one laptop with an 8 GB GPU.
The experiment in one paragraph
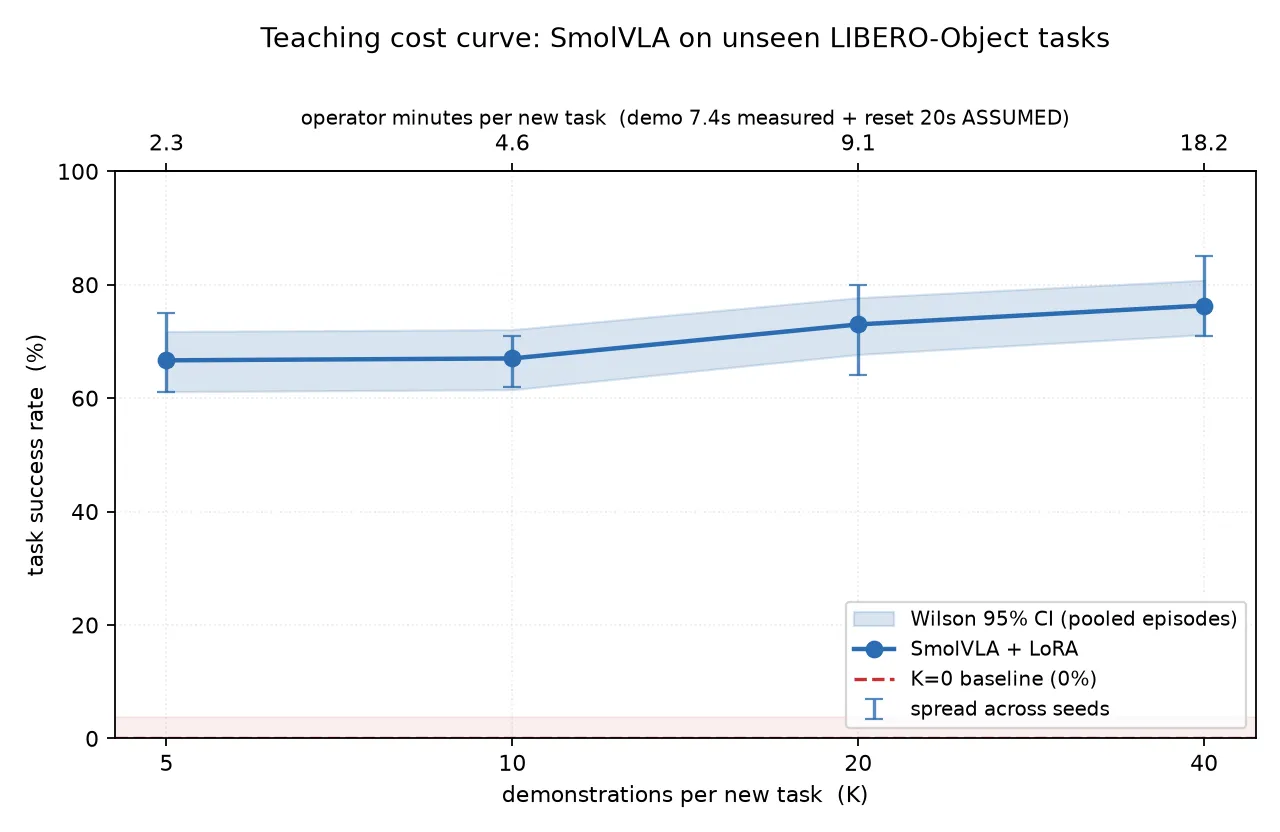
I took SmolVLA, a 450M-parameter VLA, and first trained it on three LIBERO task suites (1,239 demonstrations) to play the role of the cell’s existing line. Then I held out a fourth suite, libero_object, as the new parts: ten pick-and-place tasks the model had never seen. For each K of 5, 10, 20 and 40, I fine-tuned a LoRA adapter (0.66% of the weights) on K demonstrations per new task and evaluated on all ten tasks, 10 episodes each, over three seeds. That is 300 rollouts per point.
The answer: five
With zero demonstrations the cell’s own model solves none of the new parts. With five, it solves 66.7%. Forty demonstrations, eight times the operator effort, only add 9.6 more points.
If an operator needs about 30 seconds per demonstration including the reset, five demonstrations is a coffee break. That was the headline I hoped for. The part I did not expect came next.
The catch nobody puts on the slide
I evaluated the fine-tuned checkpoints on the suite they were originally trained on. The old line went from 38% to 0%. Not degraded: gone. Five demonstrations of a new part were enough to erase it.
That is classic catastrophic forgetting, and it follows directly from continuing to train one adapter on nothing but the new task. In practice there is a cheap way out. A LoRA adapter here is 11.9 MB, so a plant can keep one per product and load the right one when the line changes over. But “a library of per-part adapters” is a different product from “one model that knows the whole line,” and I think anyone evaluating these systems should hear that in the same breath as the 66.7%.
Getting an honest number was the real work
Most of my time did not go into training. It went into making sure the number meant what I thought it meant. Four traps nearly fooled me:
The dataset lies about its frame rate. The metadata says fps: 10. LIBERO actually controls at 20 Hz. The field is a playback label. Had I trusted it, every operator-time figure on the x-axis would have been doubled.
The sample-size flag is not just a sample size. In LeRobot’s evaluation, n_episodes also decides which initial states the rollouts start from. Two sweeps at different resolutions are therefore different experiments, not a subset and a superset. My analysis scripts now refuse to pool them.
A determinism check can pass for the wrong reason. I compared success flags between repeated runs to prove evaluation was deterministic. That check passes trivially when the baseline fails every episode, since all zeros match all zeros. The check that actually works compares the rollout video bytes.
Training loss points the wrong way. K=5 converges to a third of K=40’s loss and performs worse. With this little data, lower loss mostly means more memorisation. I stopped using loss for anything except spotting crashed runs.
What this does and does not show
It shows that on LIBERO, in simulation, a small VLA can pick up a new pick-and-place task from five demonstrations on consumer hardware, and that doing so naively destroys what it knew before.
It does not show anything about real robots. The sim-to-real gap is unmeasured, failure modes are not yet classified, and this is one model on one benchmark. The operator-time axis also rests on an assumed 20-second reset between demonstrations, which I could not measure from the dataset. That assumption rescales the x-axis but not the shape of the curve.
The code, the committed results and a build journal (in Turkish) with all the wrong turns are on GitHub. The next step I care about is the same curve on a real arm.